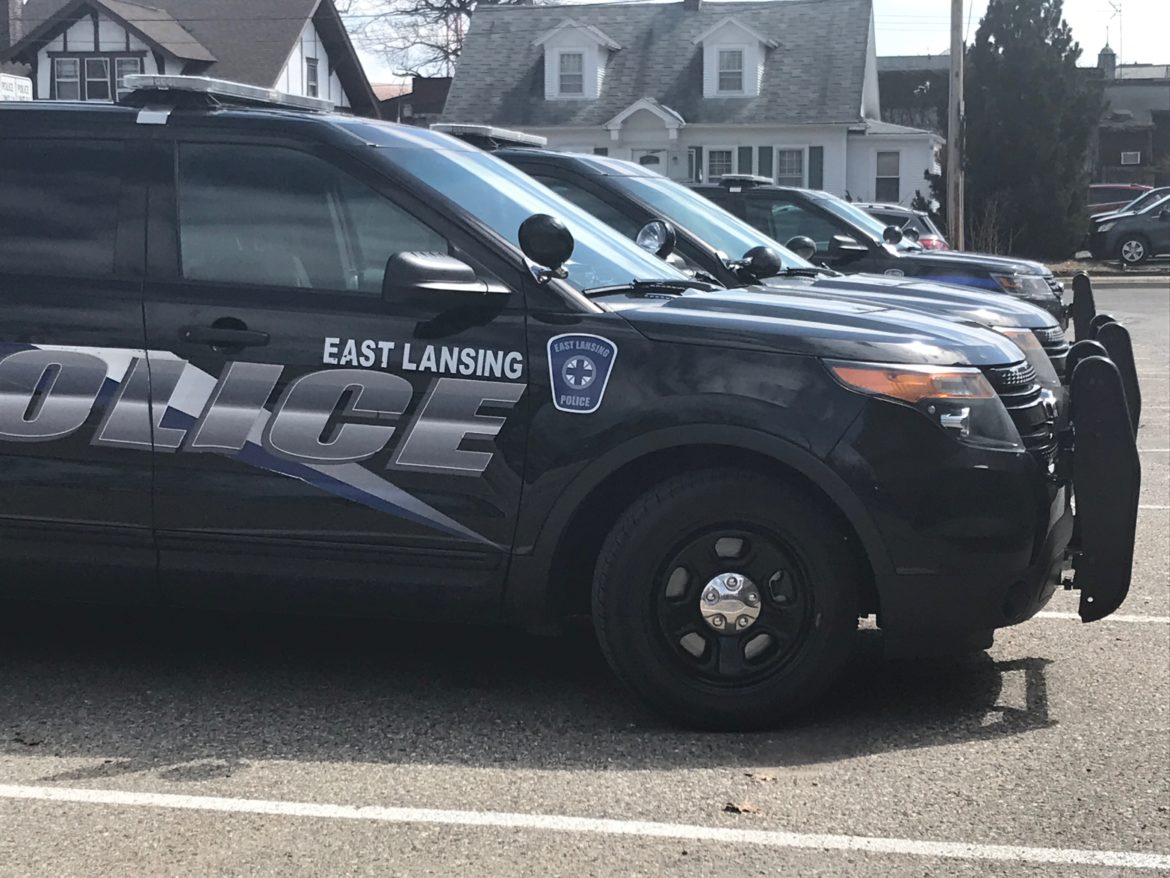
A graph about police killing unarmed people based on race/ethnicity
According to the Washington Post 987 people were killed by the police in 2017, and that is a lot of people.
The graphic here focuses on how the police interacts with the African-American community. Both groups have a history of coexisting and not getting along.
The data of the graph shows that a higher percentage of blacks killed are unarmed. However, they’re being killed more often. The question that to toss in the air is, why? Why do the police feel more threaten by black more then every other race?
Link to sources:
https://thesocietypages.org/toolbox/police-killing-of-blacks/
https://www.washingtonpost.com/graphics/2018/national/police-shootings-2018/?utm_term=.375bd30d03dc
